

EUR/JPY Price Analysis: Bullish momentum upheld, short-term market correction on the horizon

- The daily RSI was rejected near the overbought region.
- Hourly chart indicators show a shift in short-term dynamics, with sellers gaining ground.
- Despite the signs of potential short-term bearish correction, the pair still holds above key SMAs, denoting an overall bullish trend.
The EUR/JPY pair shows slight losses of 0.26% during Thursday’s session. Despite sporadic fluctuations, there is a largely upward trend, indicating a strong position for buyers. Yet, recent subtle signs of selling pressure hint at a potential challenge to the continuity of the bullish trend for the next sessions.
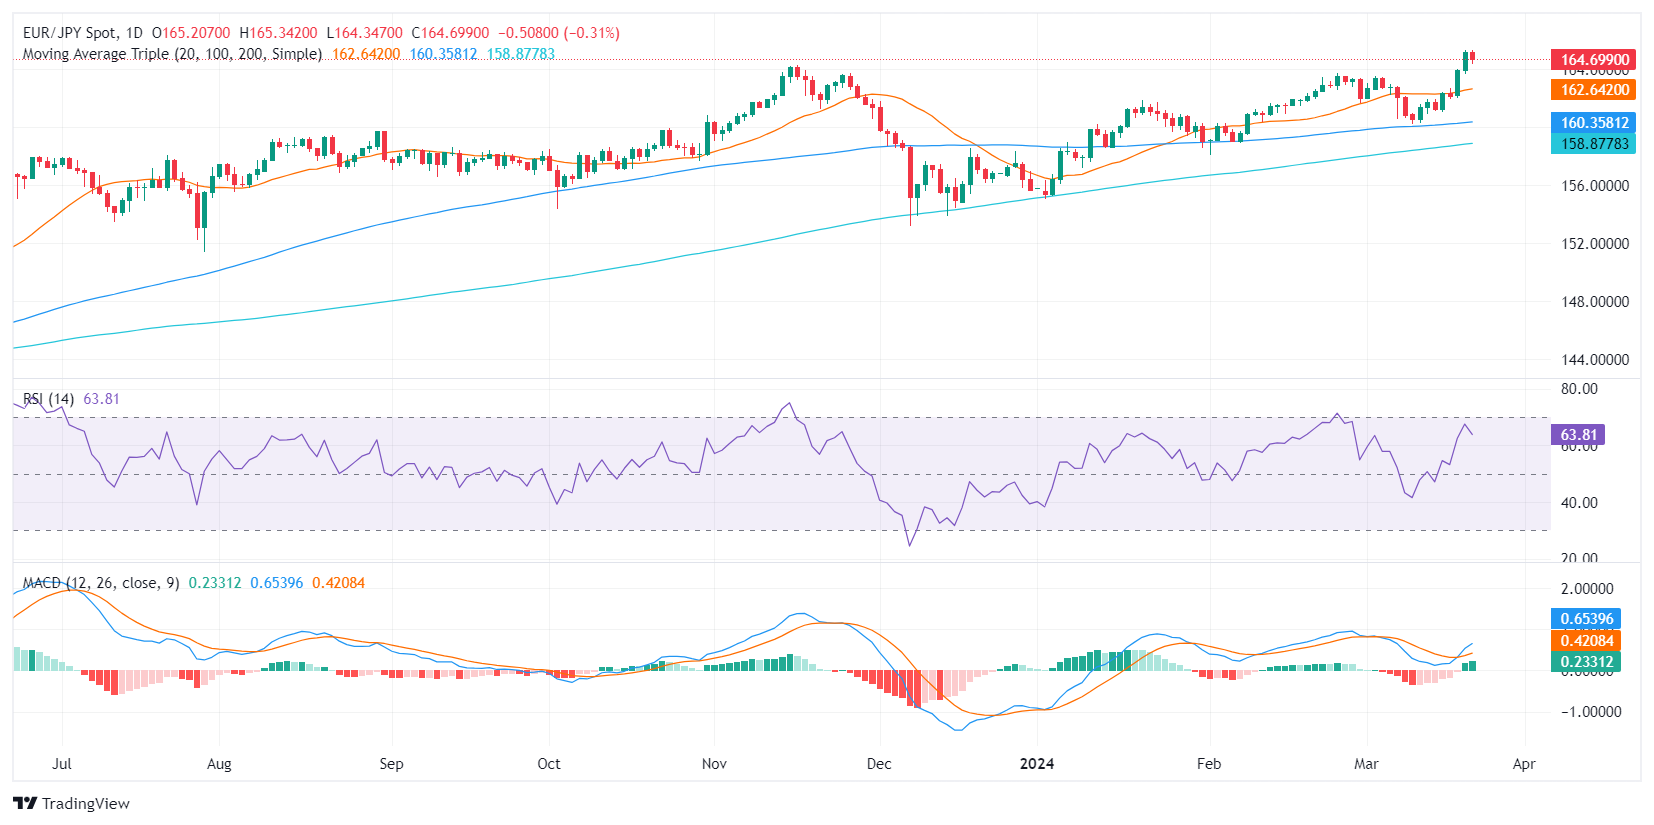
On the daily chart, the Relative Strength Index (RSI) shows an overall positive trend. However, imminent overbought conditions suggest a possible downward retracement could soon emerge as buyers may continue taking profits. In addition, the Moving Average Convergence Divergence (MACD) continues to print green bars, suggesting a steady buying momentum
EUR/JPY daily chart
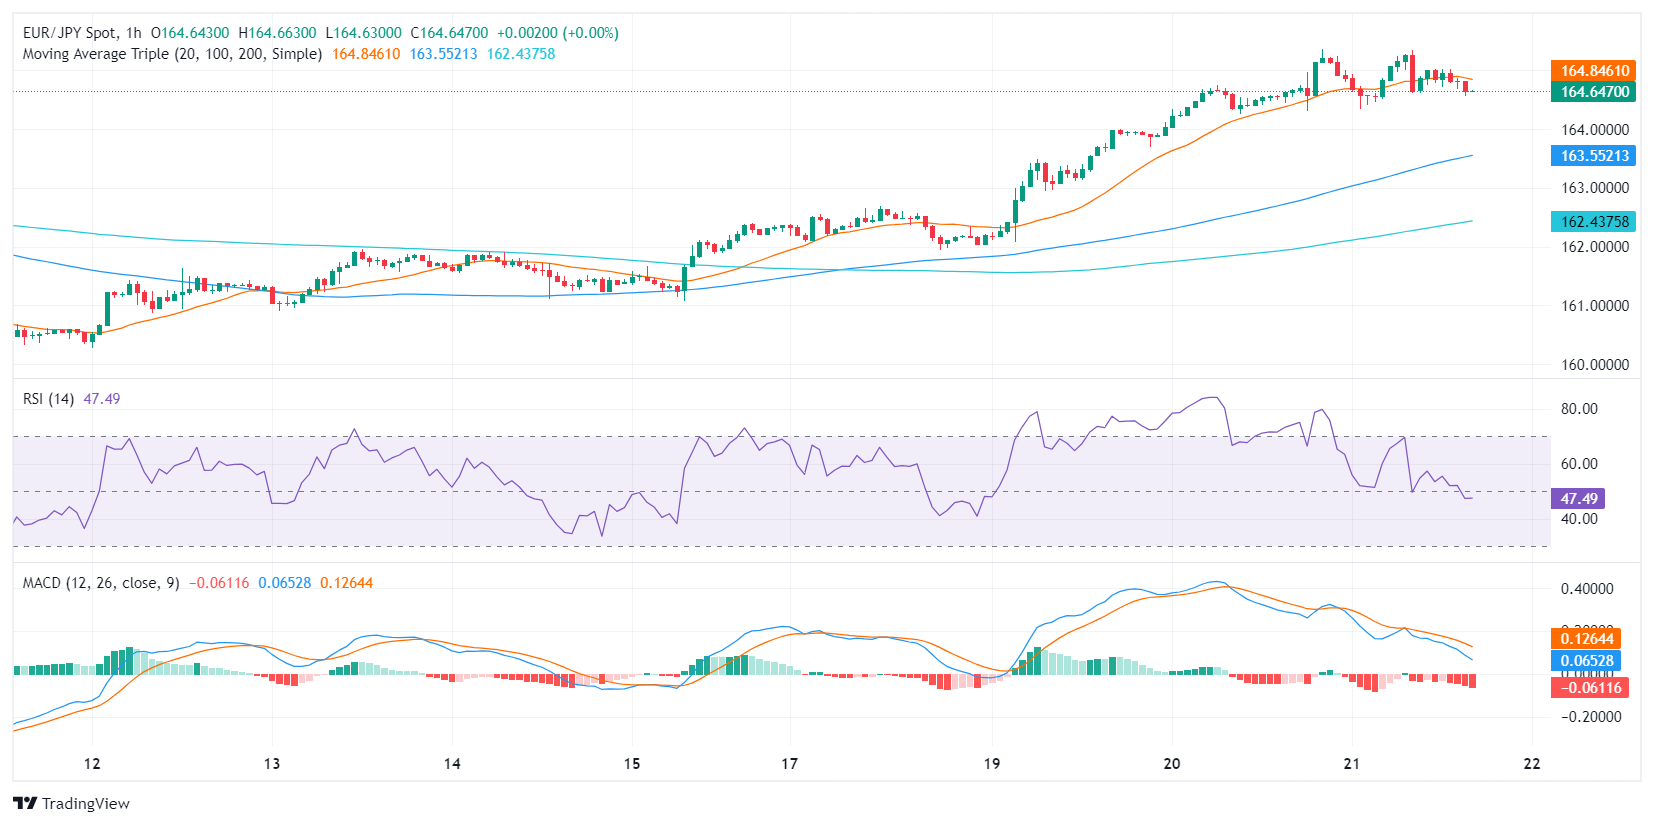
When examining the hourly chart, the RSI reveals some variability, with the latest reading at 47. This value is notably lower than the daily readings, suggesting that sellers might be gaining some ground in the short term. In addition, the MACD prints red bards which adds arguments to the growing selling pressure on the shorter timeframes.
EUR/JPY hourly chart
When analyzing with Simple Moving Averages (SMAs), the broader scale indicates that, despite a negative outlook in the short term, the pair maintains its position above the 20, 100, 200-day Simple Moving Averages, suggesting that, on a wider scope, the buyers are still firmly in control. However, if the technical correction extends below any of these levels the trend might slowly shift in favor of the seller.
EUR/JPY
| OVERVIEW | |
|---|---|
| Today last price | 164.73 |
| Today Daily Change | -0.48 |
| Today Daily Change % | -0.29 |
| Today daily open | 165.21 |
| TRENDS | |
|---|---|
| Daily SMA20 | 162.55 |
| Daily SMA50 | 161.37 |
| Daily SMA100 | 160.31 |
| Daily SMA200 | 158.82 |
| LEVELS | |
|---|---|
| Previous Daily High | 165.36 |
| Previous Daily Low | 163.69 |
| Previous Weekly High | 162.41 |
| Previous Weekly Low | 160.22 |
| Previous Monthly High | 163.72 |
| Previous Monthly Low | 158.08 |
| Daily Fibonacci 38.2% | 164.72 |
| Daily Fibonacci 61.8% | 164.33 |
| Daily Pivot Point S1 | 164.15 |
| Daily Pivot Point S2 | 163.09 |
| Daily Pivot Point S3 | 162.48 |
| Daily Pivot Point R1 | 165.81 |
| Daily Pivot Point R2 | 166.42 |
| Daily Pivot Point R3 | 167.48 |


