Natural Gas May Have Just Printed a Blow-Off Top — And a Textbook Shooting Star Reversal
Dual Edge Research publishes two powerful newsletters that work great individually — and even better together. The Bull Strangle Newsletter focuses on stocks and options, combining stock ownership with premium-selling strategies to generate consistent income and market-beating returns. The Smart Spreads Newsletter specializes in seasonal commodity futures spreads, offering a diversified approach with low correlation to equities. Together, they deliver a complete investment perspective — one focused on income, the other on diversification — all under one simple subscription.
A Blow-Off Top: What the Market Just Signaled
A blow-off top is a fast, emotion-driven price surge marked by vertical movement, widening intraday ranges, and a sudden spike in volume. This is often followed by an abrupt reversal once buyers run out of fuel. Natural gas checked several of these boxes:
- Steep, accelerating price action leading into Friday’s session
- Expanding intraday ranges, signaling volatility and unstable buying
- Late-stage panic/greed buying, typical when traders chase a runaway move
- An immediate rejection of new highs, a hallmark of exhaustion
This pattern is especially common in commodities, where emotion and leverage frequently amplify both the rally and the reversal.
A Clear Break of the Upward Trend Line
For weeks, natural gas had been respecting a well-defined rising trend line—a guidepost showing strong underlying demand and persistent momentum. That structure broke decisively:
- Price pushed sharply above the trend line (an overextended breakout),
- Then reversed just as sharply back below it,
- Confirming that the trend’s momentum has weakened.
A break of the primary trend line doesn’t guarantee a top, but combined with reversal candles and failed highs, it strongly raises the probability of a deeper pullback.
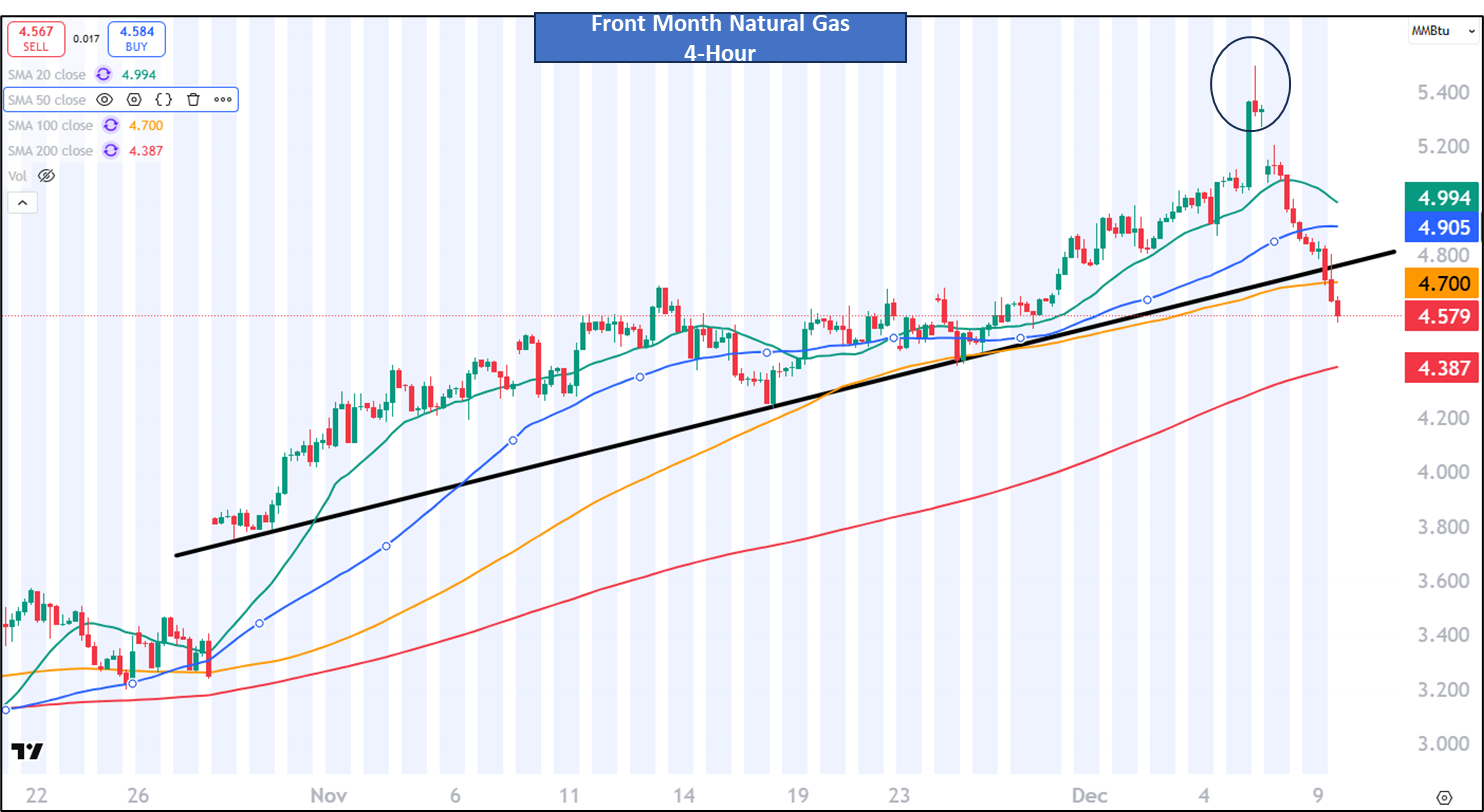
The Shooting Star Signal: A Textbook Intraday Reversal
The most important technical feature of the recent action is the shooting star candle formed by the intraday pattern that stretched across Friday and Monday. In natural gas, where volatility compresses time, multi-session intraday candles often tell the same story as a single-day pattern. A shooting star is one of the most reliable bearish reversal formations. It appears near the end of an uptrend and reflects a battle between buyers and sellers:
- Price surges strongly at the open
- Pushes to a new high, often dramatically
- Then reverses sharply lower
- Closes near its session low, leaving a long upper wick and a small real body
That’s exactly what unfolded:
- Friday’s intraday spike set the “wick”—an aggressive extension higher.
- Monday’s early attempt to push higher failed immediately.
- Selling pressure took control, leaving the combined pattern looking like a classic shooting star perched at the top of a parabolic run.
This is particularly bearish when it forms:
- After a fast vertical rally
- Near a major psychological level
- After a break of trend support
- With momentum oscillators at overbought extremes
All of these conditions were present.
Why This Matters for Natural Gas Traders
A shooting star after a blow-off top isn’t just a soft warning—it often marks a pivot from euphoria to distribution. Historically, similar setups lead to:
- Sharp mean-reversion pullbacks
- A resetting of speculative positioning
- Choppy to lower prices as the market digests the reversal
The combination of overextended price action, failed highs, and a broken trend line substantially raises the odds of a multi-session correction.
Key Levels to Watch
While specific levels may vary based on your charting system, here are the structural markers traders should closely monitor:
- High of the wick: A break back above that intraday peak would invalidate the shooting star.
- First support zone: Typically the last consolidation shelf beneath the trend.
- Volume behavior: Increasing volume on down days confirms distribution is underway.
- Natural gas seasonality: Late-winter rallies often fail once the market shifts from weather risk to storage trajectories.
Bottom Line
Natural gas may have just completed a textbook reversal: a blow-off top, a break of the rising trend line, and a multi-session shooting star. This constellation of signals is one of the strongest bearish technical combinations in commodity trading. While the longer-term narrative for natural gas remains driven by weather, storage, and structural demand, the short-term technical picture has shifted sharply. Traders should be prepared for heightened volatility and the potential for a deeper pullback as the market digests the recent euphoric rally.