Commodity benchmarks such as the S&P GSCI and, most crucially, the Bloomberg Commodity Index (BCOM) are undergoing their annual rebalancing. This process adjusts for shifts in price performance, production levels, and market liquidity. Given the extraordinary volatility witnessed throughout 2025, markets are bracing for significant reshuffling. The BCOM rebalancing is scheduled for January 8–14, 2026, though target weights—calculated on a five-year historical rolling average—were disclosed well in advance.
With Bloomberg estimating that passive funds (primarily ETFs) tracking the index manage upwards of $100 billion, the scale of 2025’s price movements could trigger heightened volatility in early January. It is important to note, however, that rebalancing is a mechanical indexing rule rather than a fundamental economic shift. Furthermore, the vast majority of these funds do not “physically” replicate the index’s underlying commodities. What, then, should investors expect in the coming days?
Mechanism of Weight Adjustments
BCOM rebalances every January using a 2:1 ratio of liquidity data to global production data. While target weights were announced in October 2025, the actual rebalancing by funds occurs within a five-day trading window in early January. To minimize tracking error, funds typically align their trades closely with the index’s recalibration. Regulatory constraints are also in play: no individual commodity may exceed a 15% allocation, and no single sector can surpass 33%.
The BCOM rebalancing coincides with that of the S&P GSCI (January 8–15, 2026), creating a dense concentration of passive flows. Theoretically, such significant turnover could pressure the front end of the futures curve as positions are liquidated or established in bulk. This may create short-term anomalies, providing entry points for investors as markets normalize.
BCOM Sector Allocations for 2026
Energy remains the dominant sector at 29.44%, despite a slight decline reflecting lower weights for Natural Gas and WTI. The most striking change is the widest WTI–Brent spread in BCOM history: WTI has fallen to an all-time low of 6.64%, while Brent has climbed to a record high of 8.36%. This shift underscores a migration of liquidity toward European benchmarks.
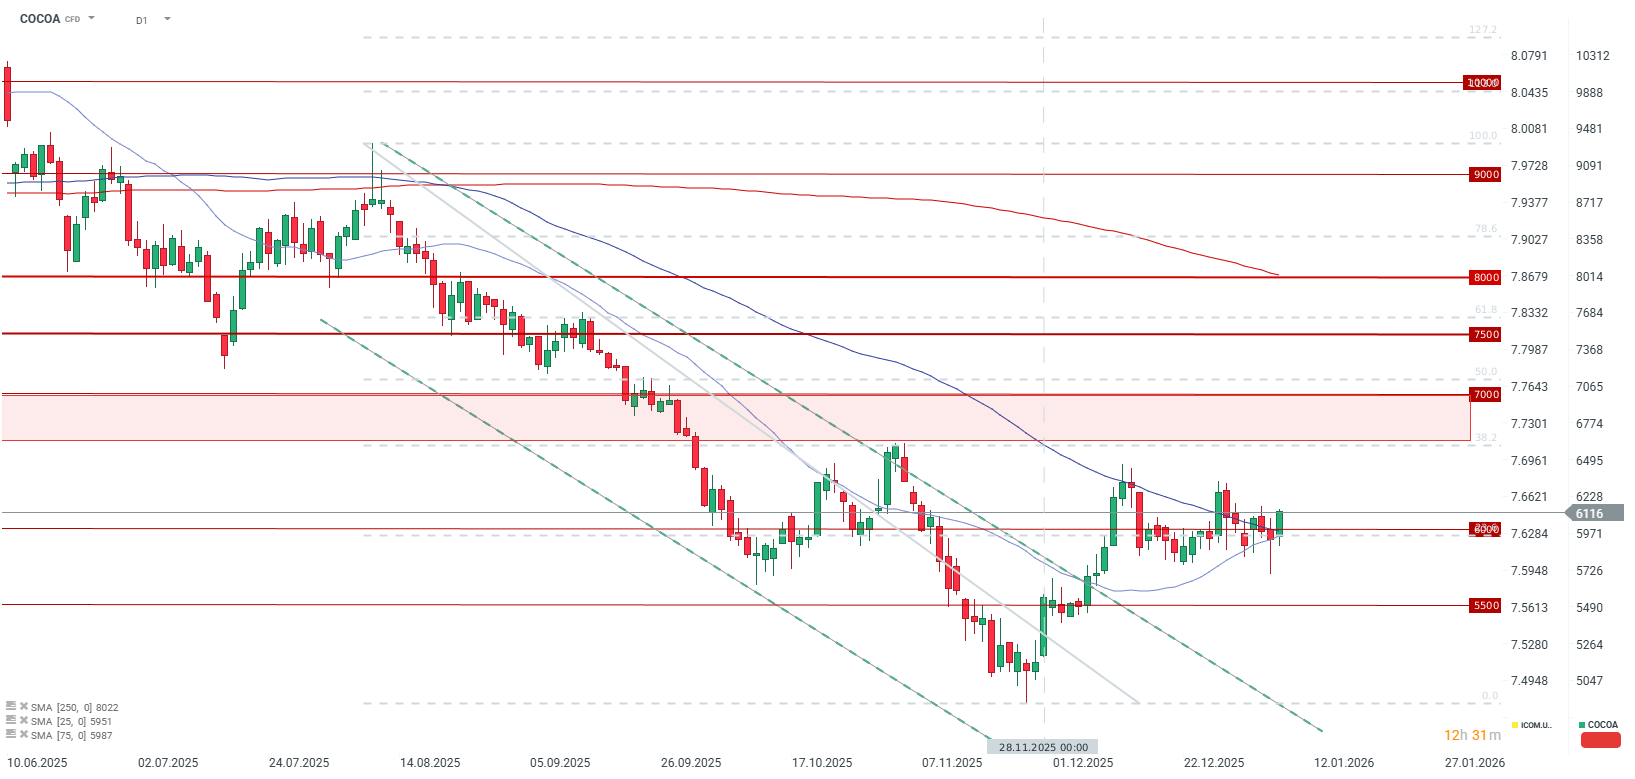
Precious metals see their share rise slightly to 18.84%, though internal dynamics are shifting. Industrial metals have climbed to 15.76%, bolstered by copper’s rally last year, while the Grains sector has declined to 21.15%. Perhaps the most notable structural change is the “triumphant return” of Cocoa. After a 21-year hiatus (having been excluded in 2005), Cocoa rejoins the 25-commodity index with a 1.71% weight, having met liquidity and production thresholds for two consecutive years.
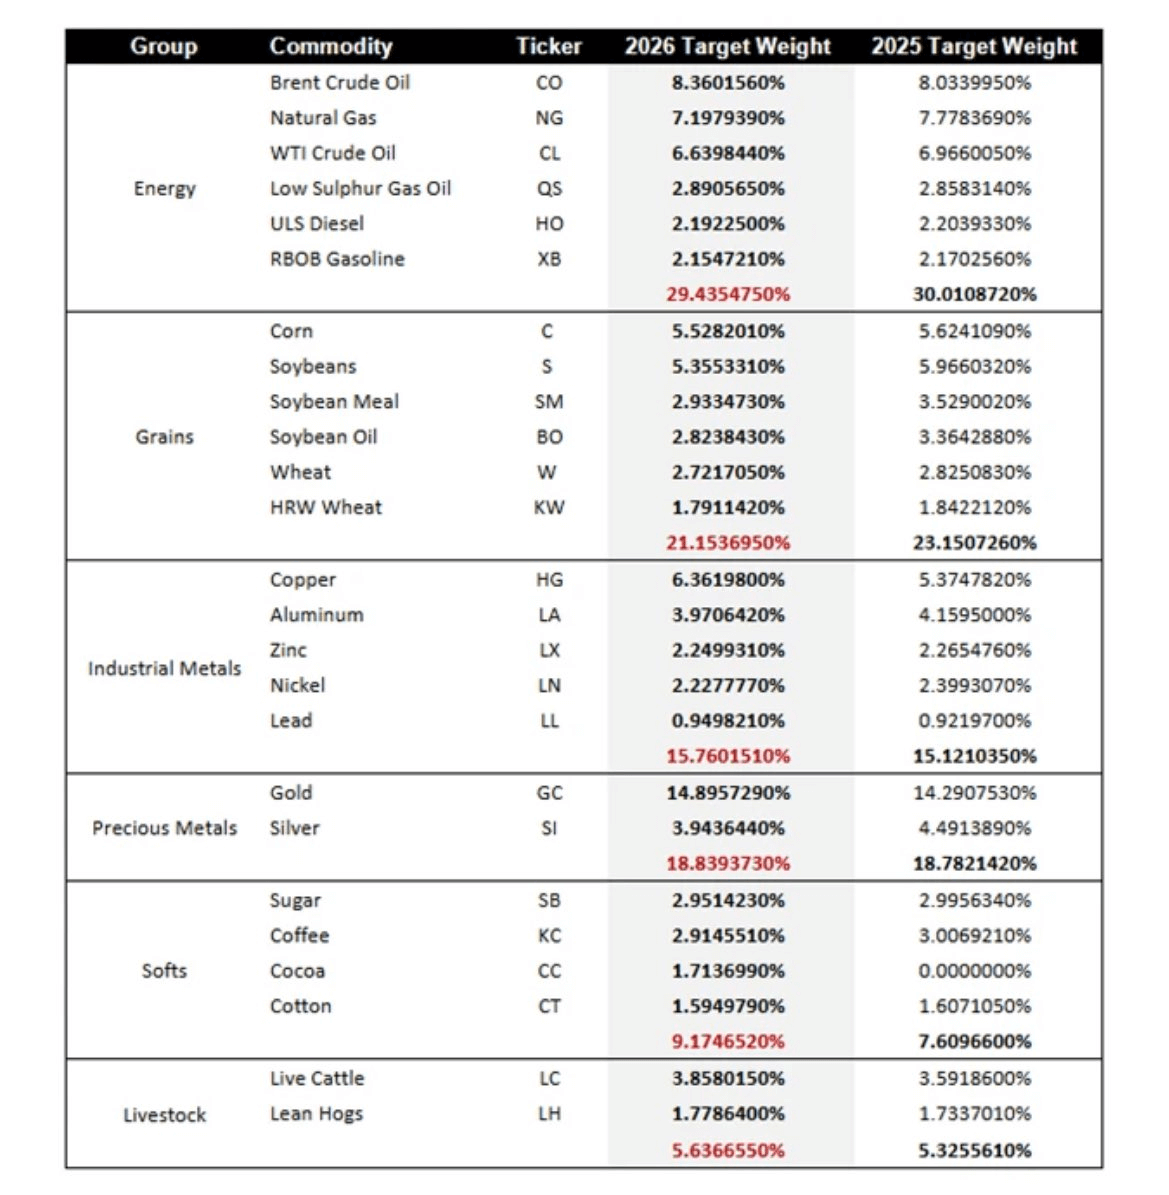
New weights in the Bloomberg Commodity Index compared to 2025 targets. The most significant shifts include the widening Brent-WTI spread, a reduction in silver’s weight, and the inclusion of cocoa. Source: Bloomberg Finance LP
Key Weight Shifts: Mean Reversion in Metals
While target weights rarely deviate drastically year-over-year, the gap between current “real” weights and new targets is substantial.
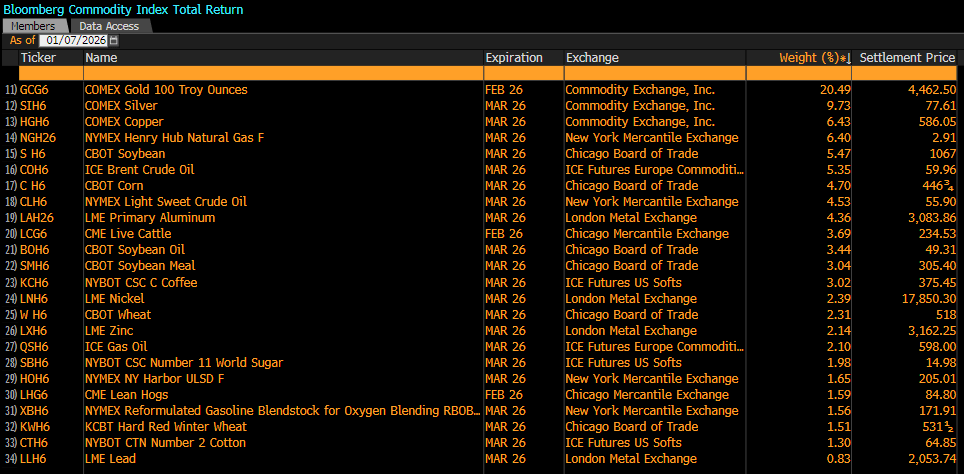
Silver currently accounts for nearly 10% of the Bloomberg Commodity Index, while Gold exceeds 20%. The target weights are approximately 4% and 15%, respectively. Theoretically, this implies a substantial sell-off by passive funds. Source: Bloomberg Finance LP
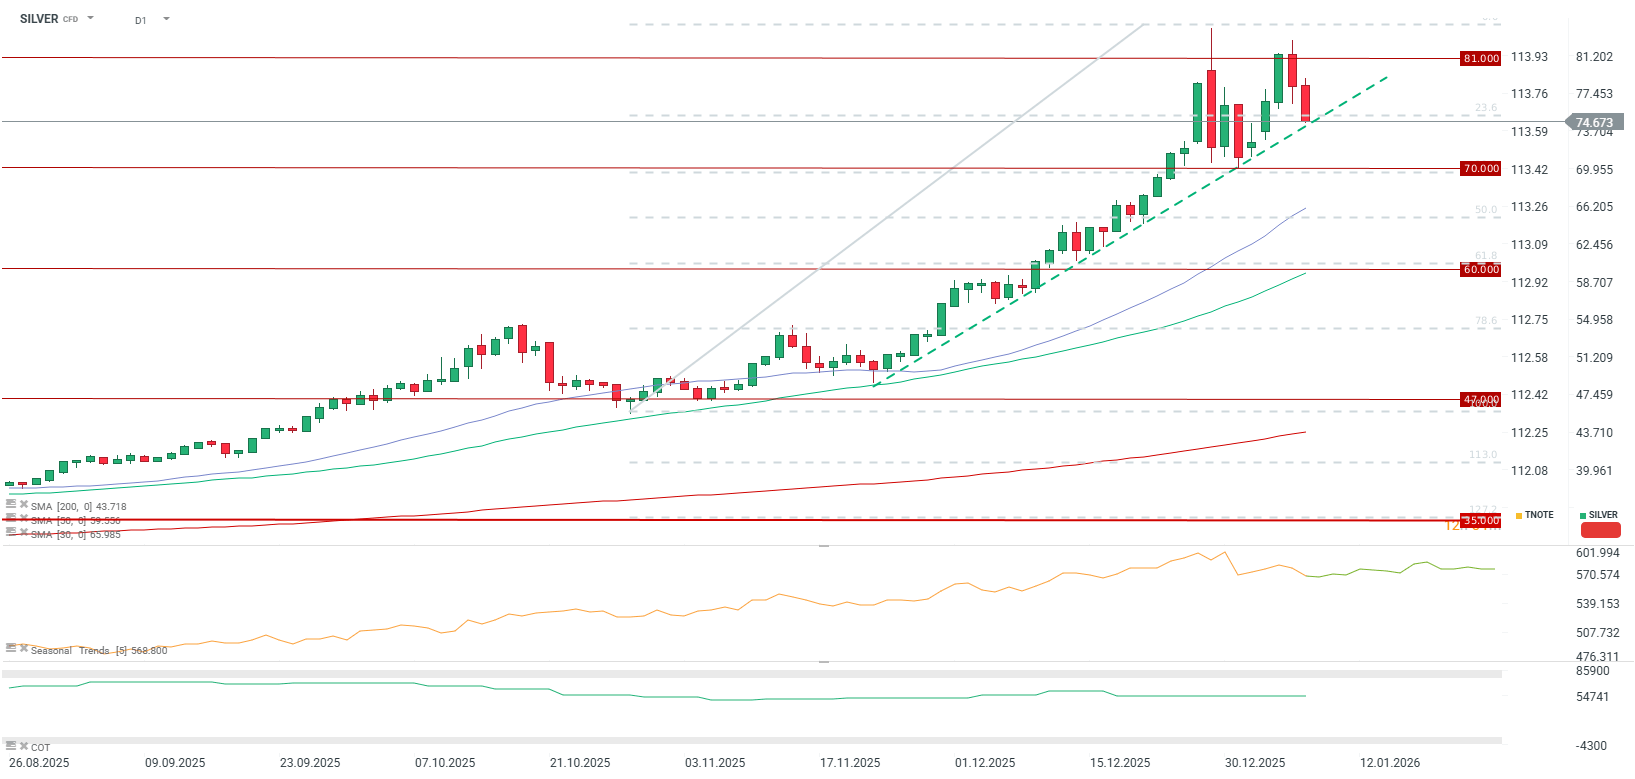
The composition changes present a clear picture of mean reversion in precious metals. Silver represents the most dramatic case: its weight is set to drop from ~9.7% (where it climbed after a +150% rally in 2025) to just under 4%. Gold, despite its historic strength in 2025, will see its target weight rise to 14.9% (from ~14.3%), though this still represents a reduction from its current effective weight of approximately 20% within the index.
In the energy complex, WTI’s weight falls from 7.6% to 6.64%, while Brent’s rise to 8.36% reinforces the index’s tilt toward the global/European benchmark. Copper gains significant ground at 6.36%, likely due to supply-side constraints, while Natural Gas slides to 7.20% amid a massive US supply glut. The return of Cocoa with a 1.71% weight marks the largest single positive addition, driven by the current supply crisis and broad price appreciation in recent years.
Assessing the “Silver Liquidation” Narrative
Based on Bloomberg’s estimate of a $100 billion market tracking the BCOM, reducing Silver’s weight from 10% to 4% could theoretically trigger the closure of $5–7 billion in futures positions. Some media outlets have portrayed this as a systemic risk, but the reality is more nuanced.
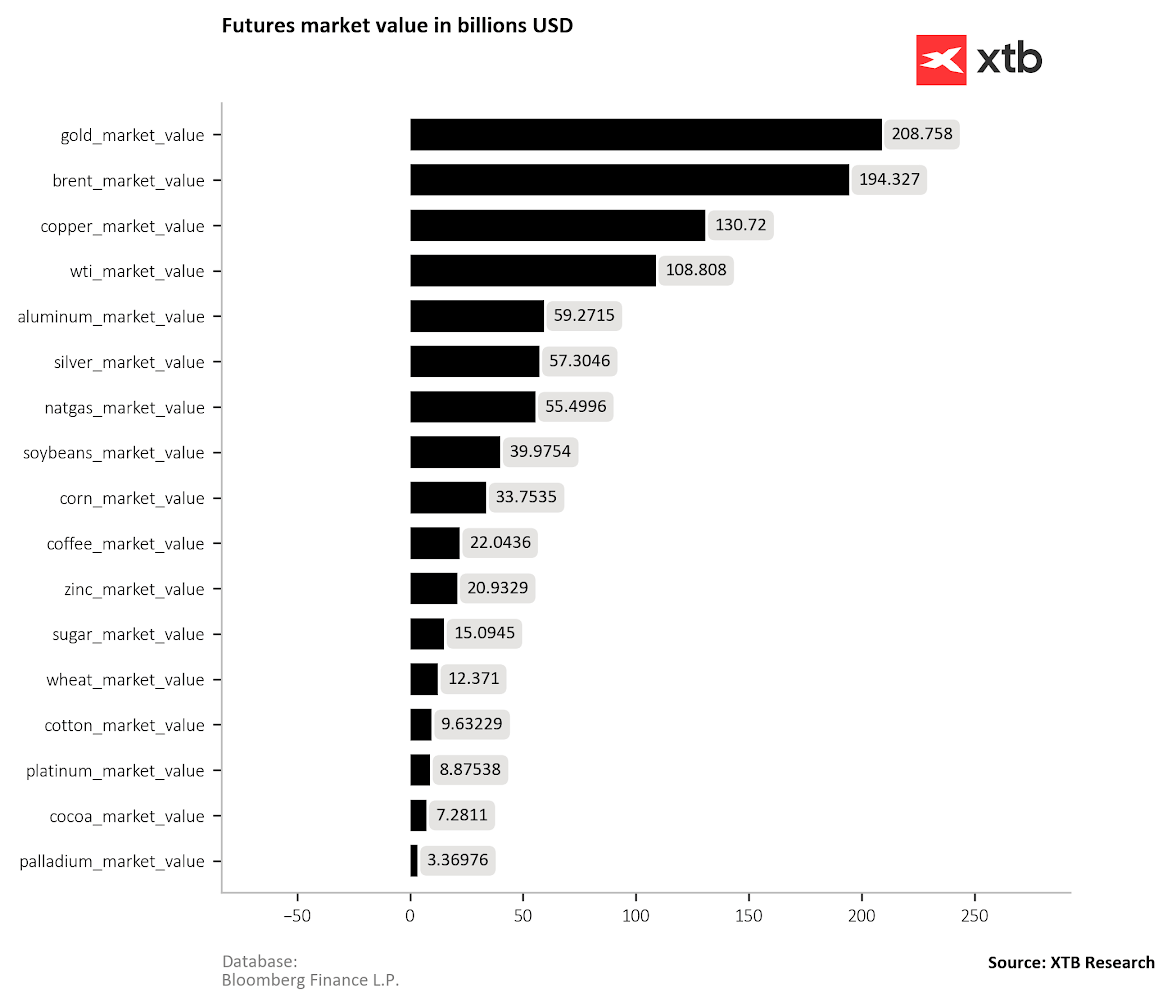
Futures market size based on the COT report for major commodities shows that $5-7 billion in silver would represent over 10% of open interest. For gold, the reshuffling would have a significantly smaller impact. Source: Bloomberg Finance LP
Firstly, the rebalancing is spread over five days. Even if we saw a 10% reduction in silver’s open interest, it would not happen in a single session. Moreover, the market has been aware of these changes since October 2025. Purely passive funds that replicate the index 100% represent only about $2.6 billion in assets under management.
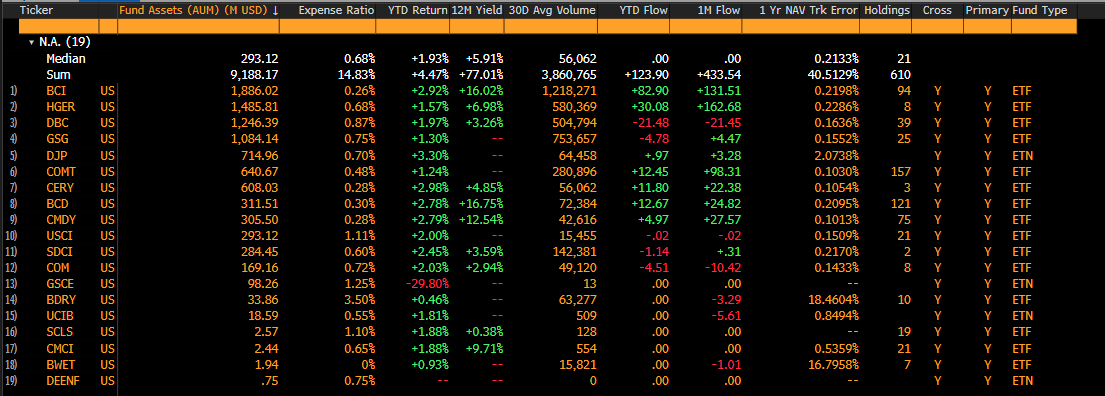
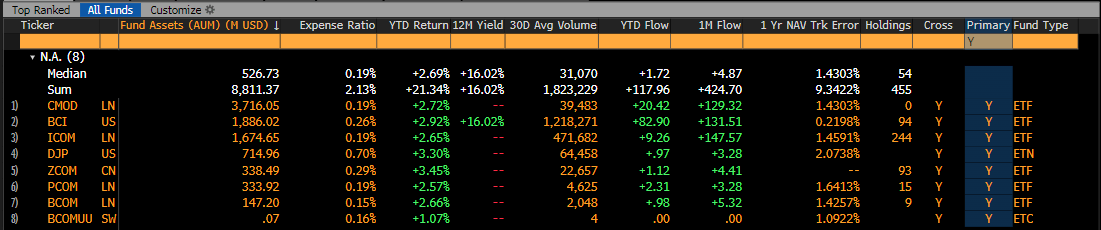
Purely passive funds based on commodity indices manage only about $9 billion. Source: Bloomberg Finance LP
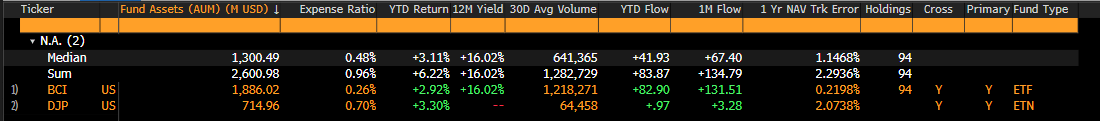
Passive ETFs tracking the Bloomberg Commodity Index with 100% replication. Source: Bloomberg Finance LP
Furthermore, the largest US-based BCOM ETF currently holds a silver weight significantly lower than the index target, using debt instruments to collateralize futures.
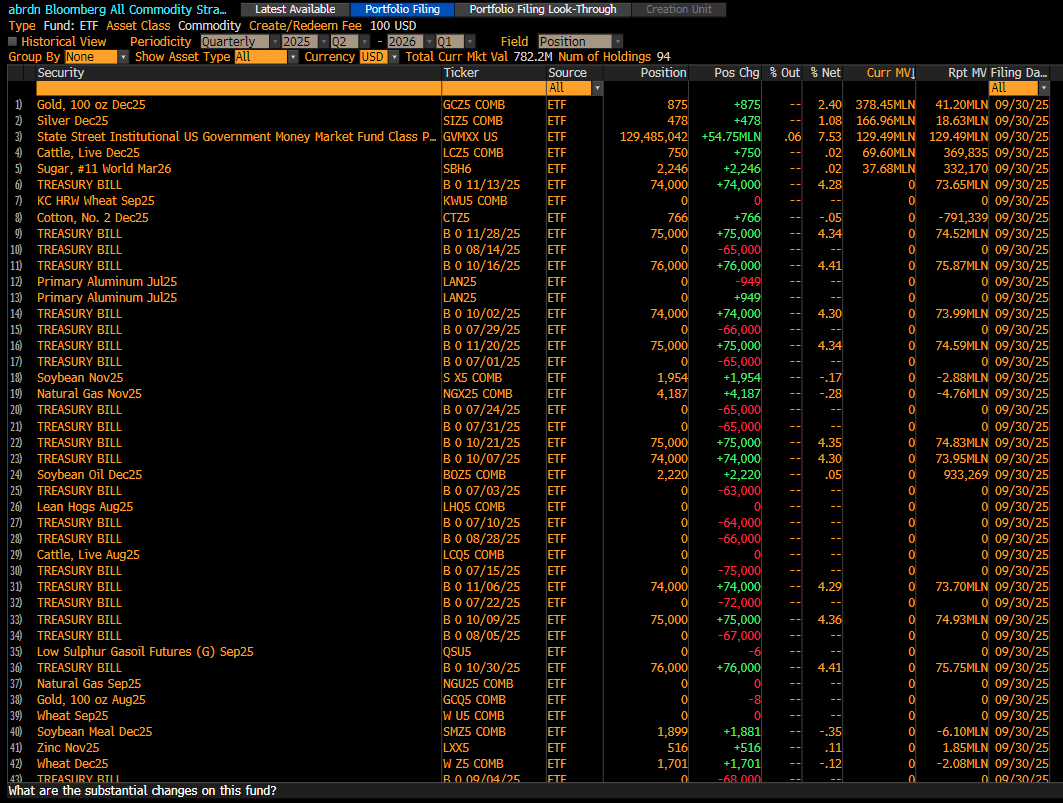
Silver’s weight is only 1% in the largest US-based Bloomberg Commodity Index ETF. Source: Bloomberg Finance LP
Synthetic ETFs, prevalent outside the US, use total return swaps. Investment banks providing these swaps manage risk dynamically and may have begun rebalancing months ago, as suggested by the decline in speculative long positions in silver recently.
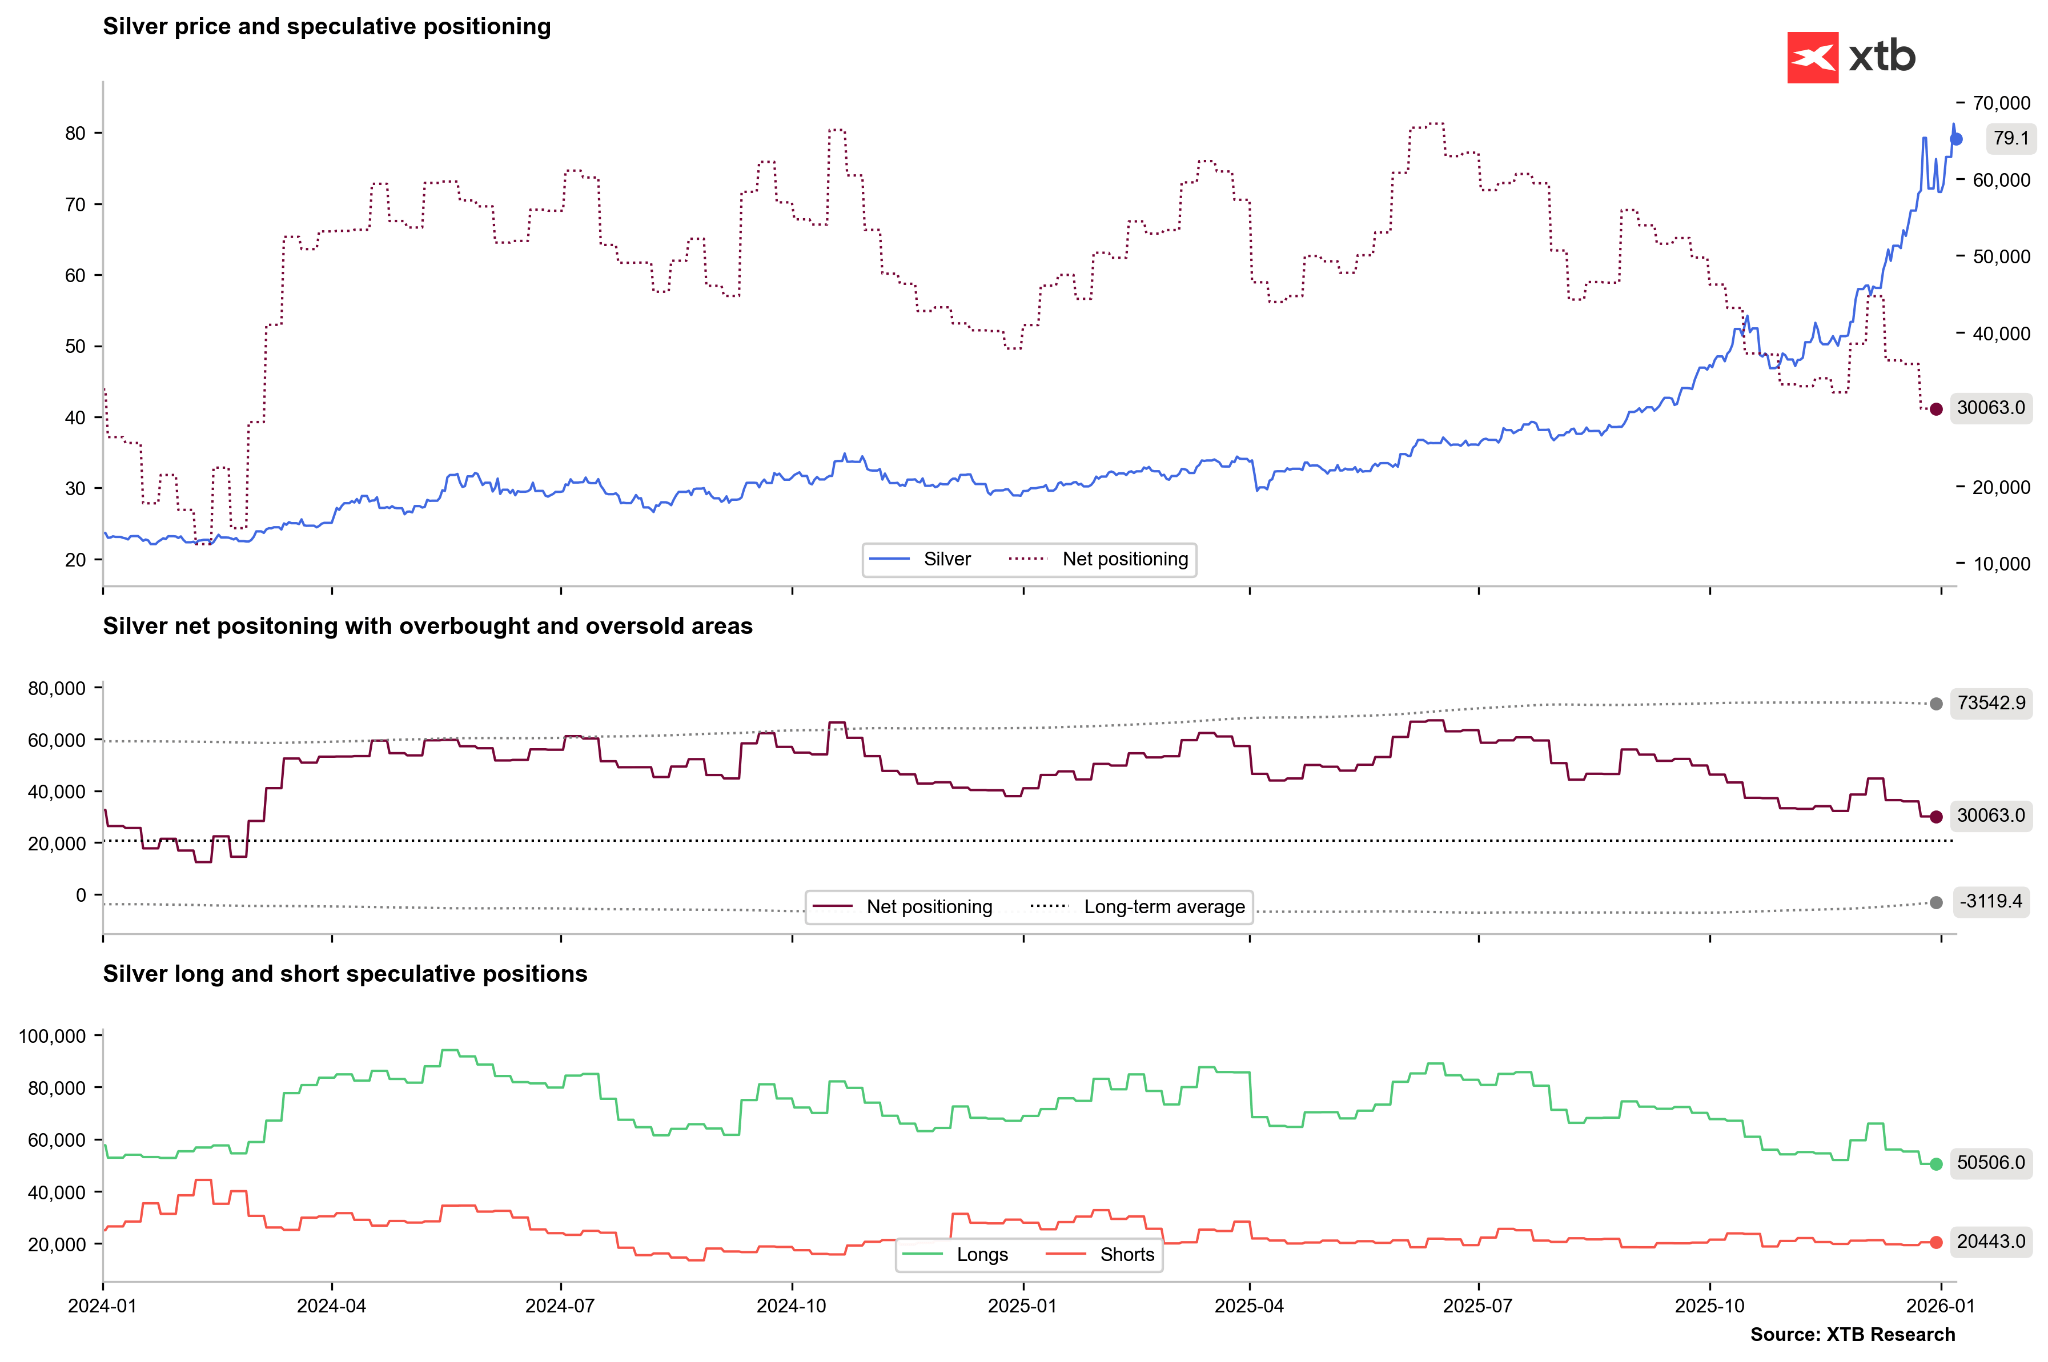
Non-commercial positions also include so-called swap positions. The number of long positions among non-commercial funds has been declining for some time. Source: Bloomberg Finance LP
Including both physically and synthetically replicated funds, the asset value is slightly higher; however, swap counterparties can manage their positions and risk with significant flexibility. Source: Bloomberg Finance LP
Sentiment Shifts in Silver ETFs
While index rebalancing may not be as catastrophic as some headlines suggest, a clear shift is visible in direct silver investment vehicles. Physical silver ETFs have been liquidating holdings since late 2025, while gold ETFs continue to see moderate buying. Simultaneously, there is a surge in units for leveraged short silver funds.
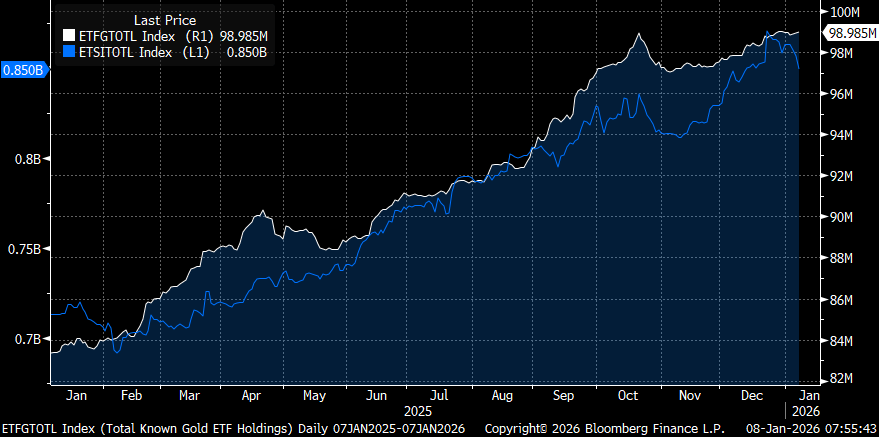
Silver ETFs began selling off silver at the end of 2025 (blue line), while gold ETFs continue to buy moderately (white line). Source: Bloomberg Finance LP
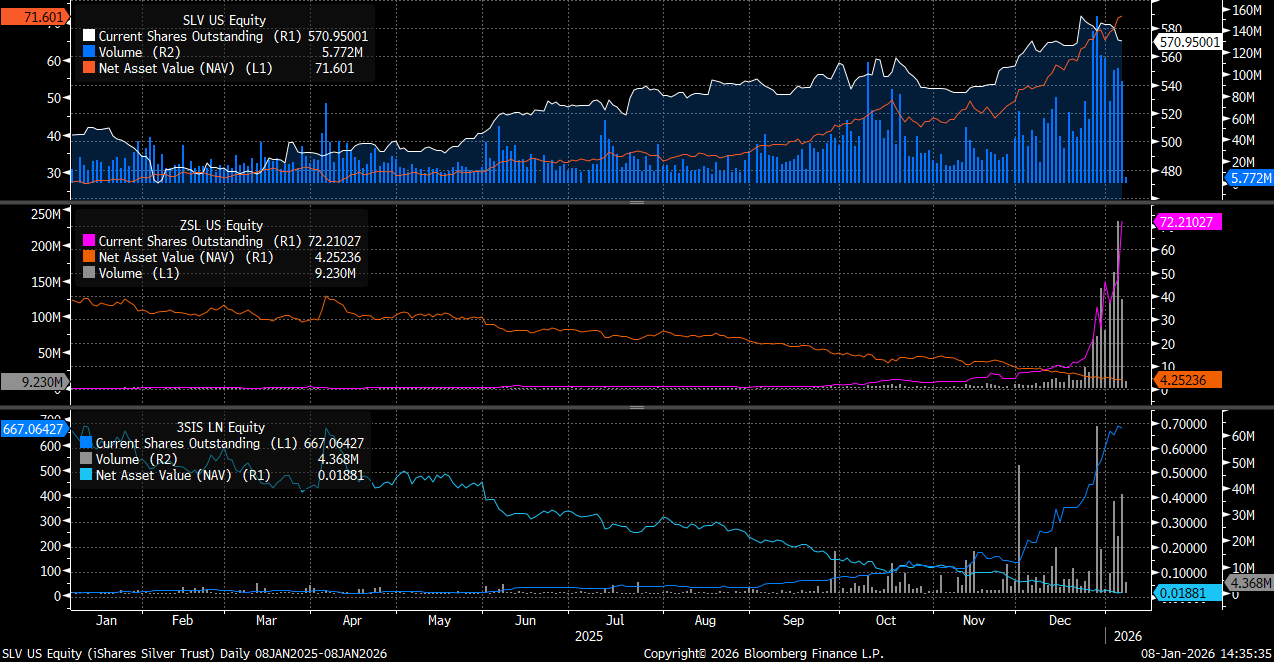
The chart shows the number of fund units, volume, and asset value for SLV, ZSL (2x short), and 3SIS (3x short) for silver. Unit counts and volumes have jumped significantly for silver-shorting funds. Source: Bloomberg Finance LP
Can Cocoa Rally on Index Inclusion?
Some analyses suggested that cocoa’s inclusion could draw over $2 billion into the futures market—a massive figure for a market valued at ~$7 billion. However, real inflows are likely to be several times smaller. Speculative activity has increased, but sellers currently dominate buyers, and liquidity remains historically low.
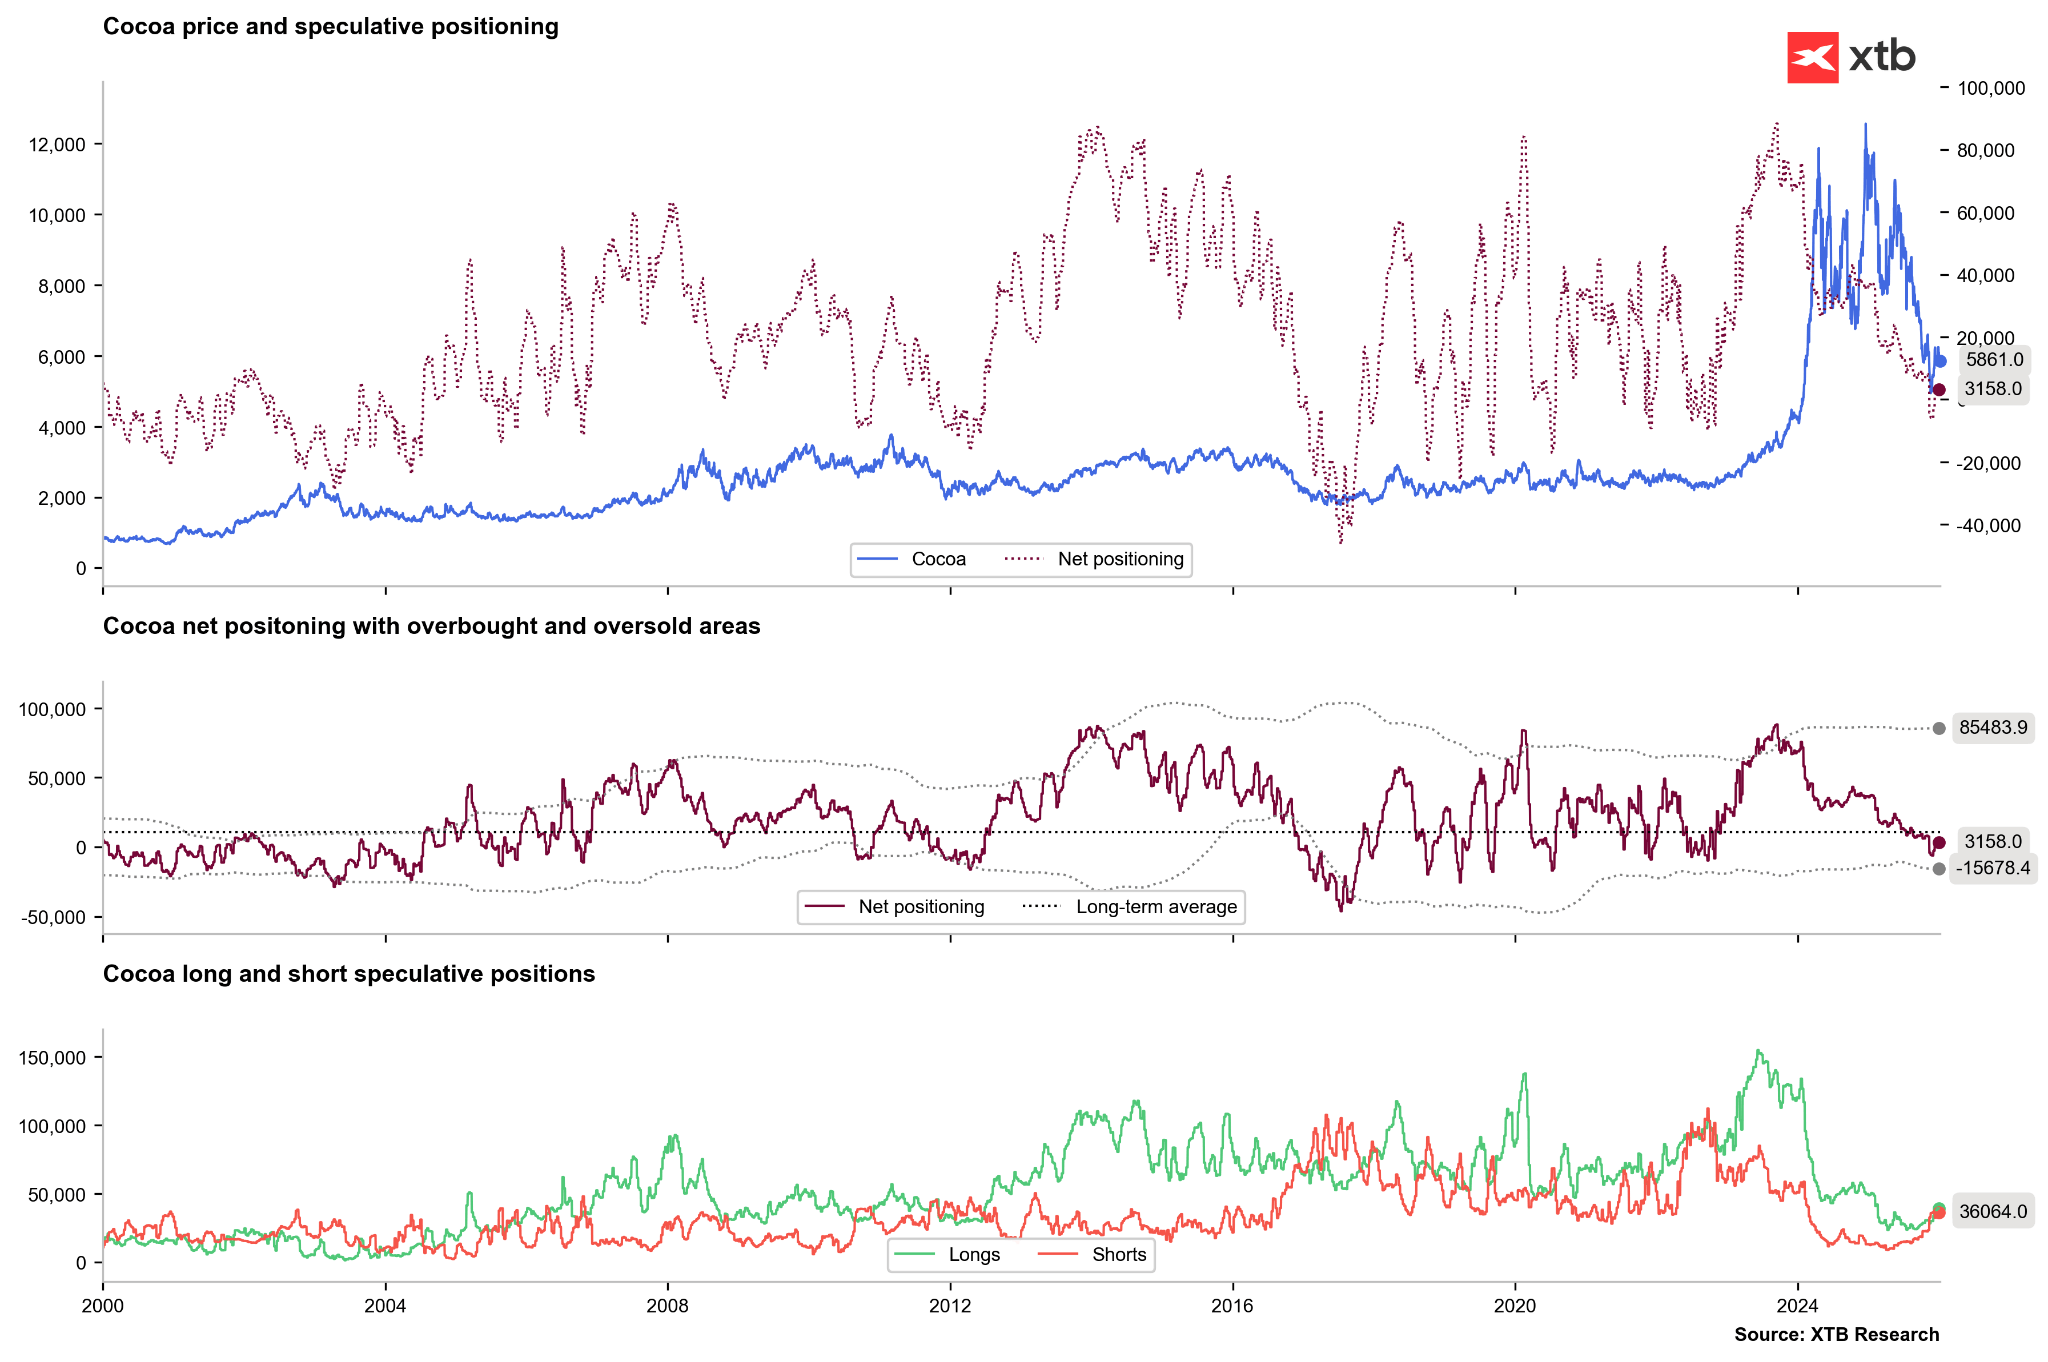
We have observed an increase in short positions and a slightly smaller increase in long positions among speculators. Net positions remain at extreme lows. Source: Bloomberg Finance LP
Outlook for Silver and Cocoa
Silver is currently undergoing a correction, dropping over $8 from its recent peak. While physical fundamentals remain unchanged, the correction could deepen below $70 per ounce if ETF liquidations persist.
Cocoa, following a brutal 2025, is showing signs of recovery. With low liquidity, even modest inflows from index rebalancing could propel prices back toward the $6,500–$6,700 per tonne range.
The material on this page does not constitute financial advice and does not take into account your level of understanding, investment objectives, financial situation or any other specific needs. All information provided, including opinions, market research, mathematical results and technical analyzes published on the Website or transmitted To you by other means, it is provided for information purposes only and should in no way be construed as an offer or solicitation for a transaction in any financial instrument, nor should the information provided be construed as advice of a legal or financial nature on which any investment decisions you make should be based exclusively To your level of understanding, investment objectives, financial situation, or other specific needs, any decision to act on the information published on the Website or sent to you by other means is entirely at your own risk if you In doubt or unsure about your understanding of a particular product, instrument, service or transaction, you should seek professional or legal advice before trading. Investing in CFDs carries a high level of risk, as they are leveraged products and have small movements Often the market can result in much larger movements in the value of your investment, and this can work against you or in your favor. Please ensure you fully understand the risks involved, taking into account investments objectives and level of experience, before trading and, if necessary, seek independent advice.