The Overbalance analysis aims to identify three financial instruments, analyzed primarily on the daily/four-hour (D1/H4) timeframe. The analysis uses only the Overbalance methodology, which helps determine where a trend may continue or where it may reverse.
Today’s analysis covers three instruments, evaluated solely in terms of 1:1 correction structures.
EURNZD
The EURNZD currency pair has been in an uptrend for quite some time, but since November 2025, we have seen a clear downward correction. However, the declines were not significant enough to break through the key support level at 1.9540, which stems from the lower boundary of the 1:1 geometric pattern. This level has already been tested twice and remains effectively defended so far. Additionally, the price is attempting to break above the local resistance at 1.9855, which stems from the upper boundary of the 1:1 downward pattern. A sustained break above this level could signal a return to the long-term uptrend.
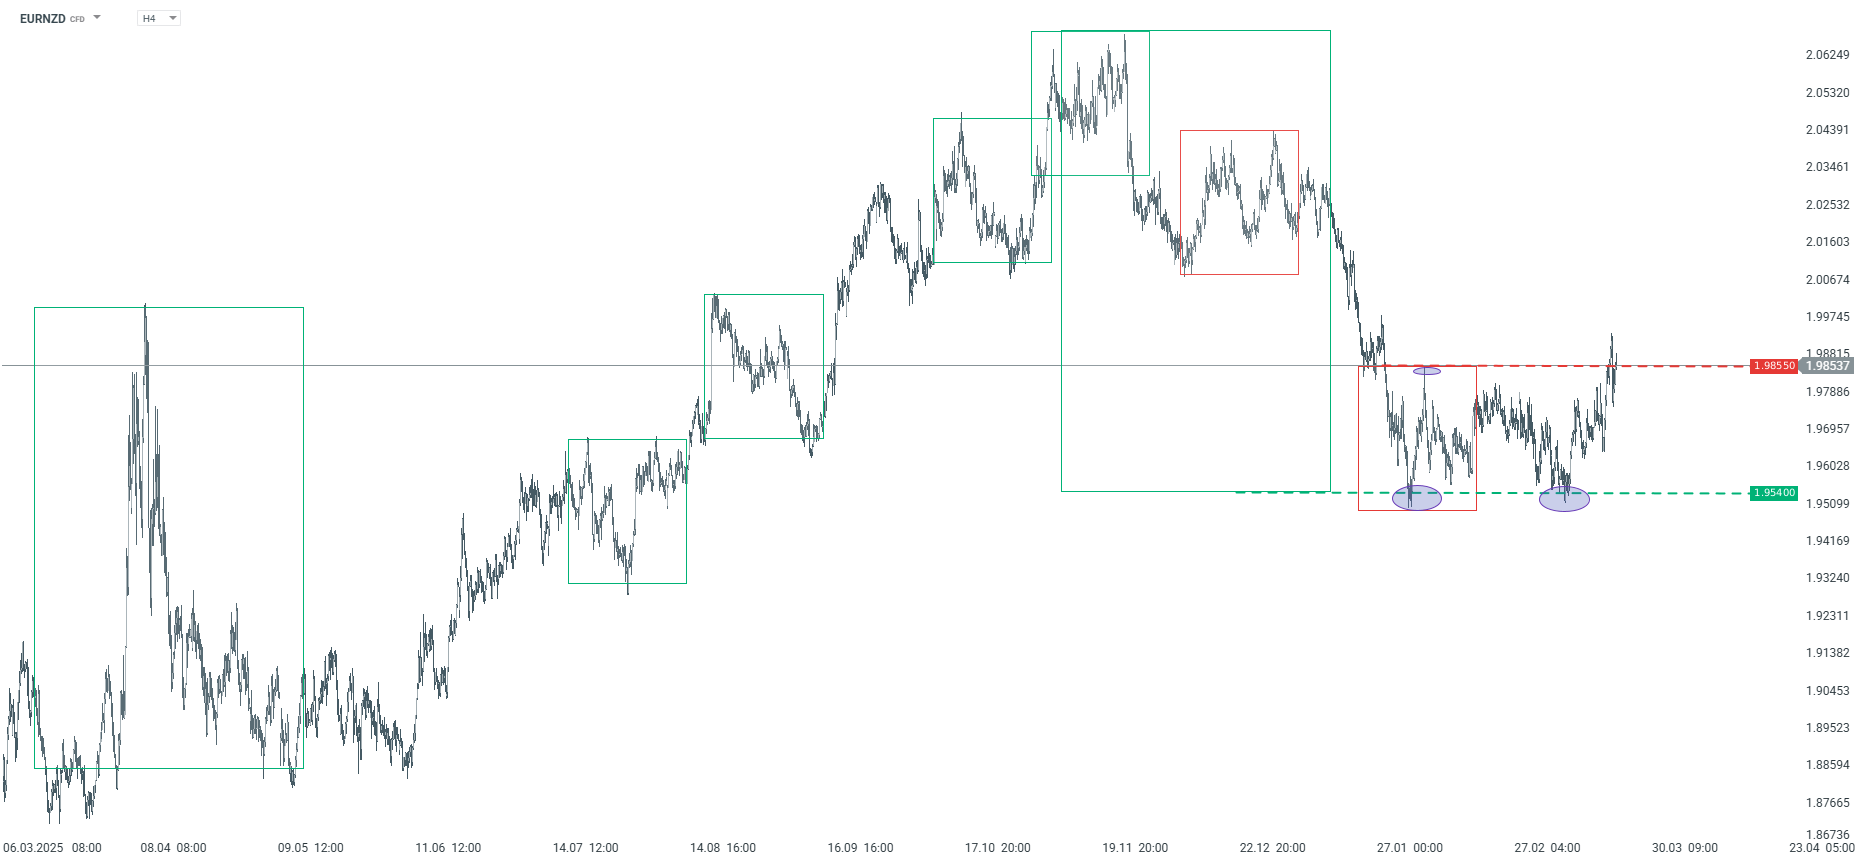
EURNZD – H4 timeframe. Source: xStation
EURCAD
EURCAD prices had been in an uptrend for quite some time, but since last October we have been observing the development of a broad downward correction. The extent of this correction has invalidated the pattern of the largest upward correction, which, in the context of the Overbalance methodology, increases the risk of a trend reversal. Currently, the 1.5945 level acts as a key resistance—this stems both from the polarity of the previous price pattern and from the upper boundary of the local 1:1 downward pattern. A break above this level could open the way for gains, while a rejection of it may result in a continuation of the downtrend.
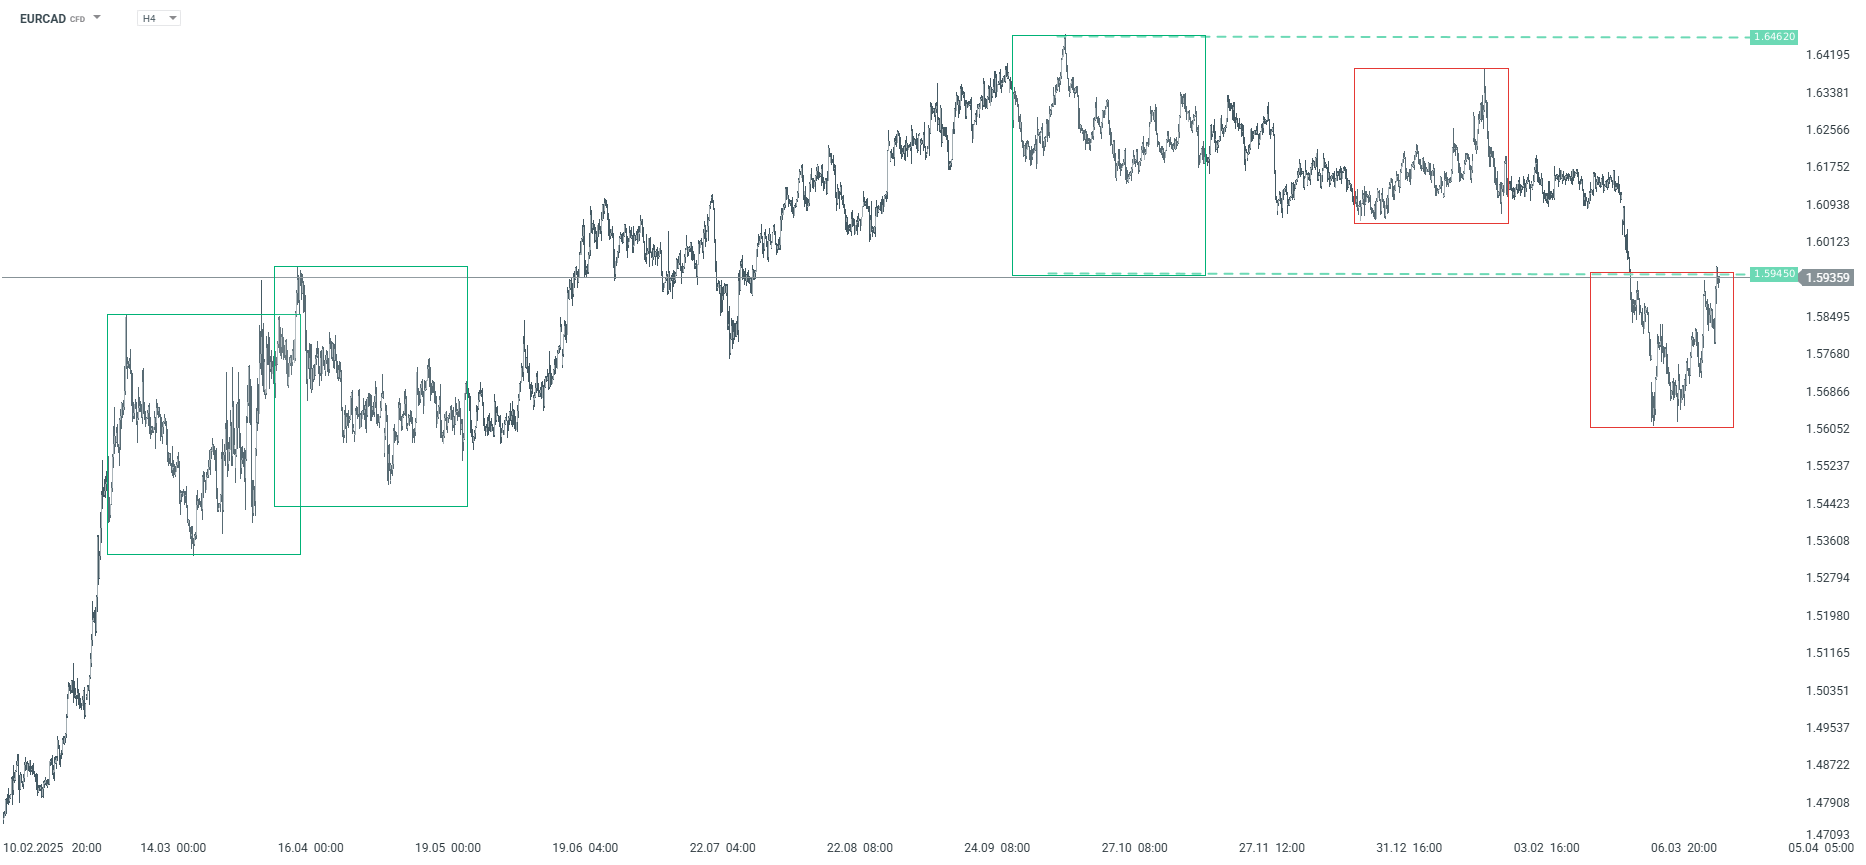
EURCAD – H4 timeframe. Source: xStation
EURUSD
The EURUSD recently broke below the support level at 1.1575, which led to a deeper downward correction. However, the decline did not last long, as the price quickly returned above that level. Currently, the 1.1575 level is a key point on the chart, as it stems both from the polarity of the previously negated upward geometry and from the upper boundary of the 1:1 downward pattern. This convergence of geometries reinforces its significance. As long as the price remains above this level, the base scenario remains a continuation of the uptrend. Conversely, a return below 1.1575 could once again open the door to declines.
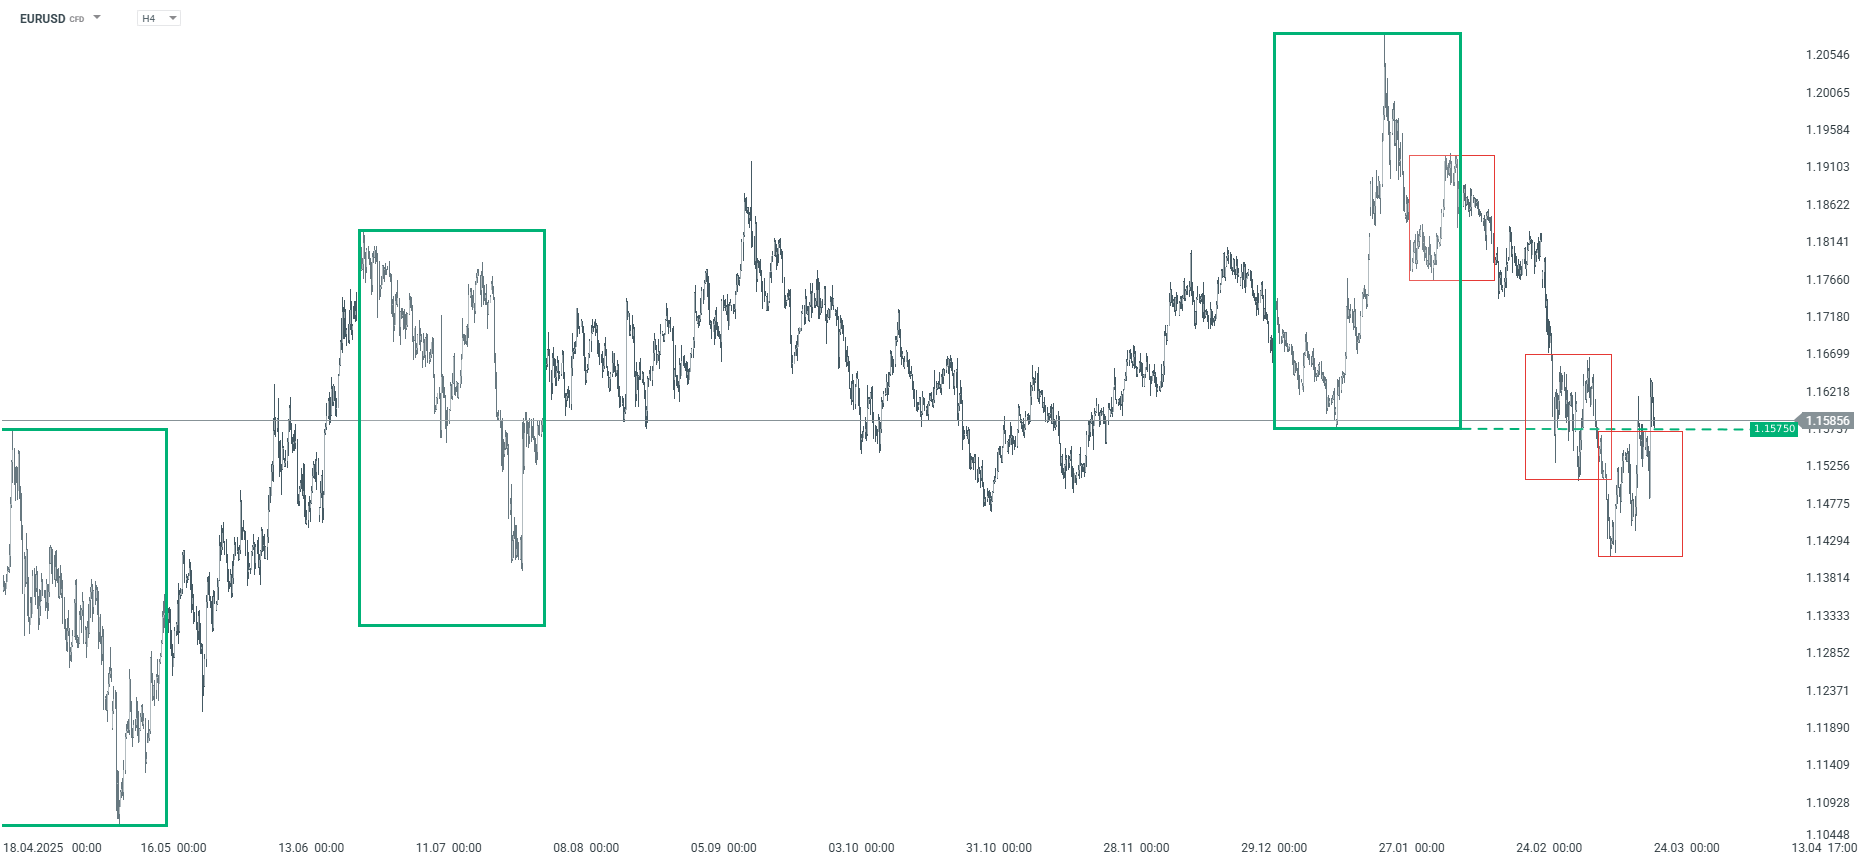
EURUSD – H4 chart. Source: xStation
The material on this page does not constitute financial advice and does not take into account your level of understanding, investment objectives, financial situation or any other specific needs. All information provided, including opinions, market research, mathematical results and technical analyzes published on the Website or transmitted To you by other means, it is provided for information purposes only and should in no way be construed as an offer or solicitation for a transaction in any financial instrument, nor should the information provided be construed as advice of a legal or financial nature on which any investment decisions you make should be based exclusively To your level of understanding, investment objectives, financial situation, or other specific needs, any decision to act on the information published on the Website or sent to you by other means is entirely at your own risk if you In doubt or unsure about your understanding of a particular product, instrument, service or transaction, you should seek professional or legal advice before trading. Investing in CFDs carries a high level of risk, as they are leveraged products and have small movements Often the market can result in much larger movements in the value of your investment, and this can work against you or in your favor. Please ensure you fully understand the risks involved, taking into account investments objectives and level of experience, before trading and, if necessary, seek independent advice.